Last year, revenues at Union Pacific
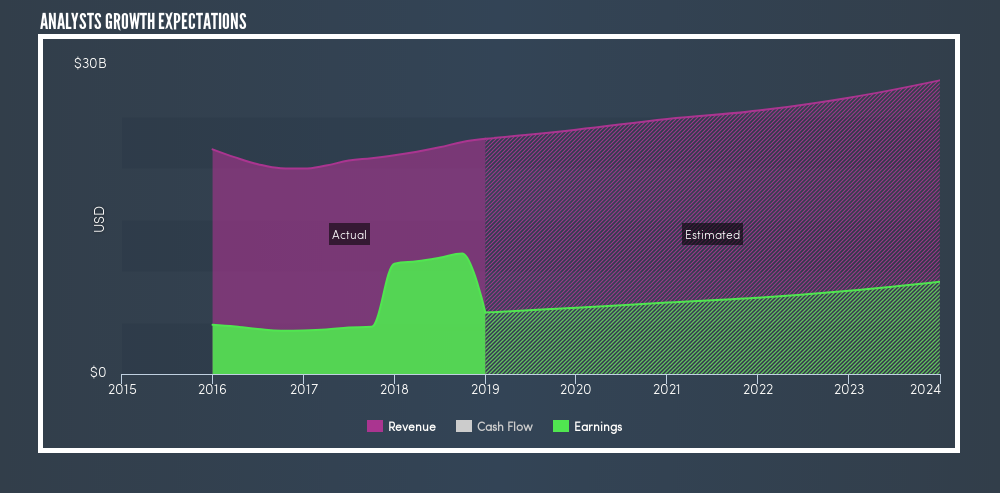
Union Pacific’s year on year earnings growth rate has been positive over the past 5 years, outperforming the transportation industry. Its earnings are expected to grow by 7.1% yearly and revenue is expected to grow by 4% yearly.
UNP Future Revenue and Net Income Expectation
Moving on to the technical picture of the stock using weekly and daily Elliott wave chart:
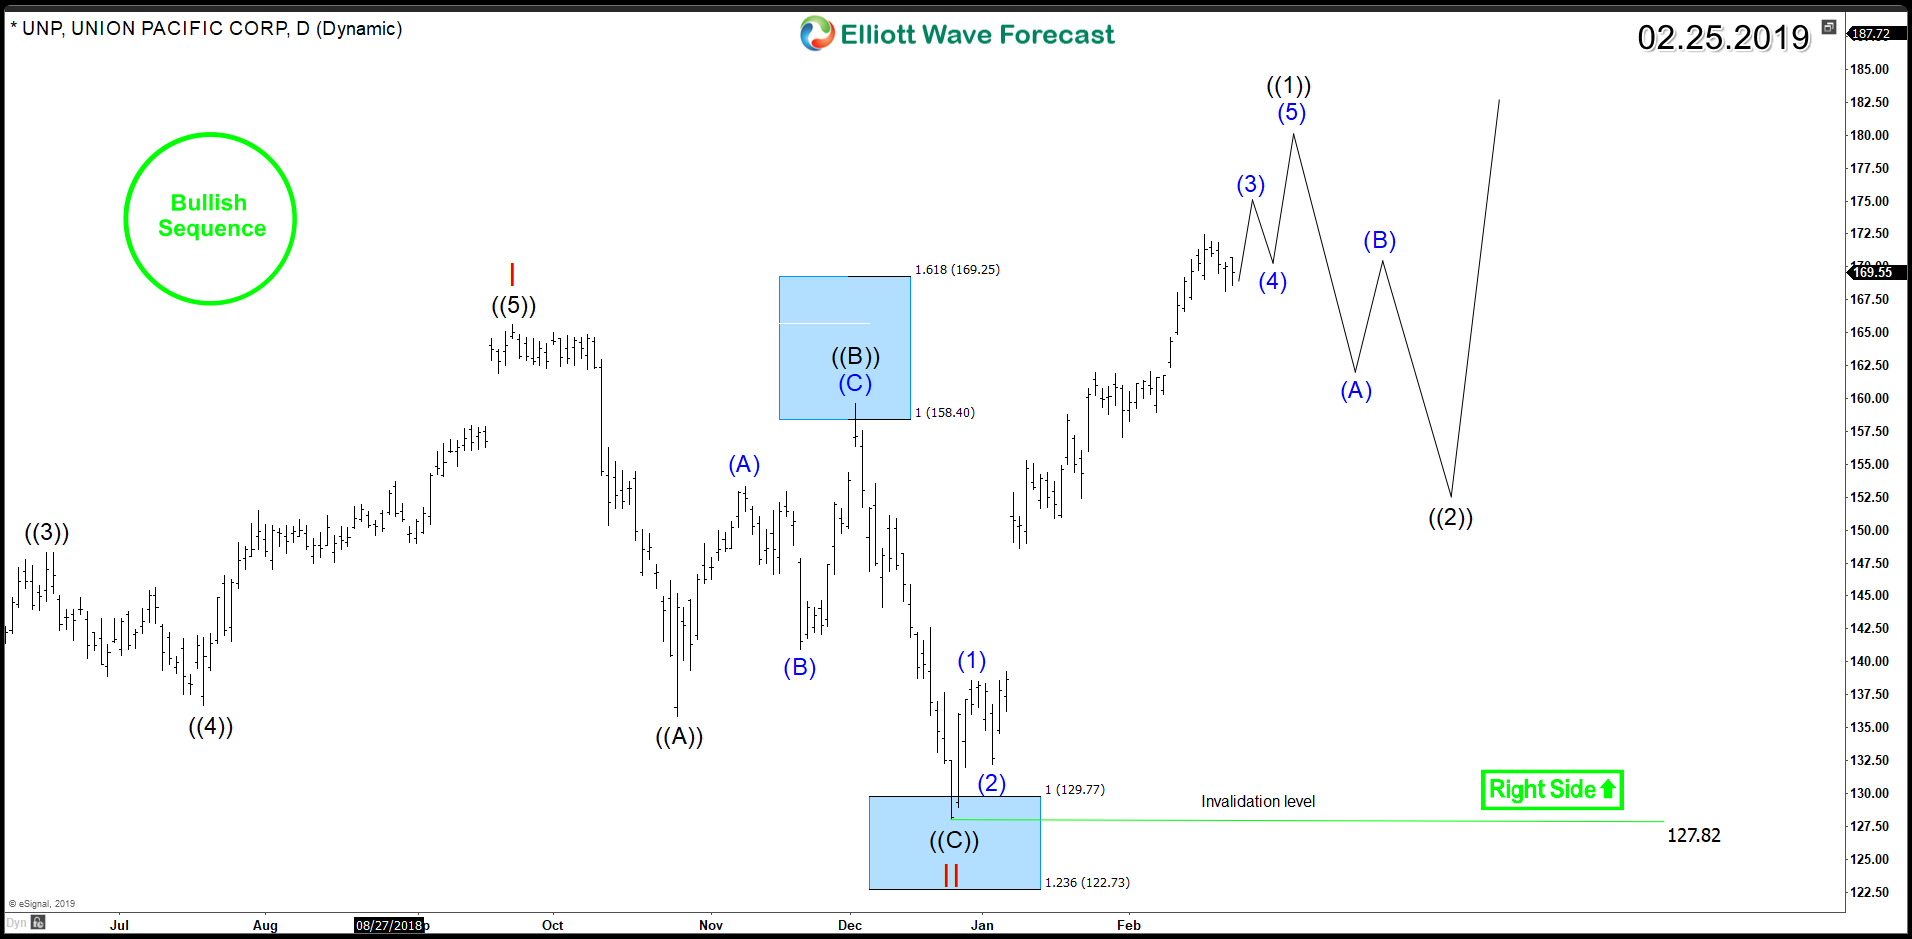
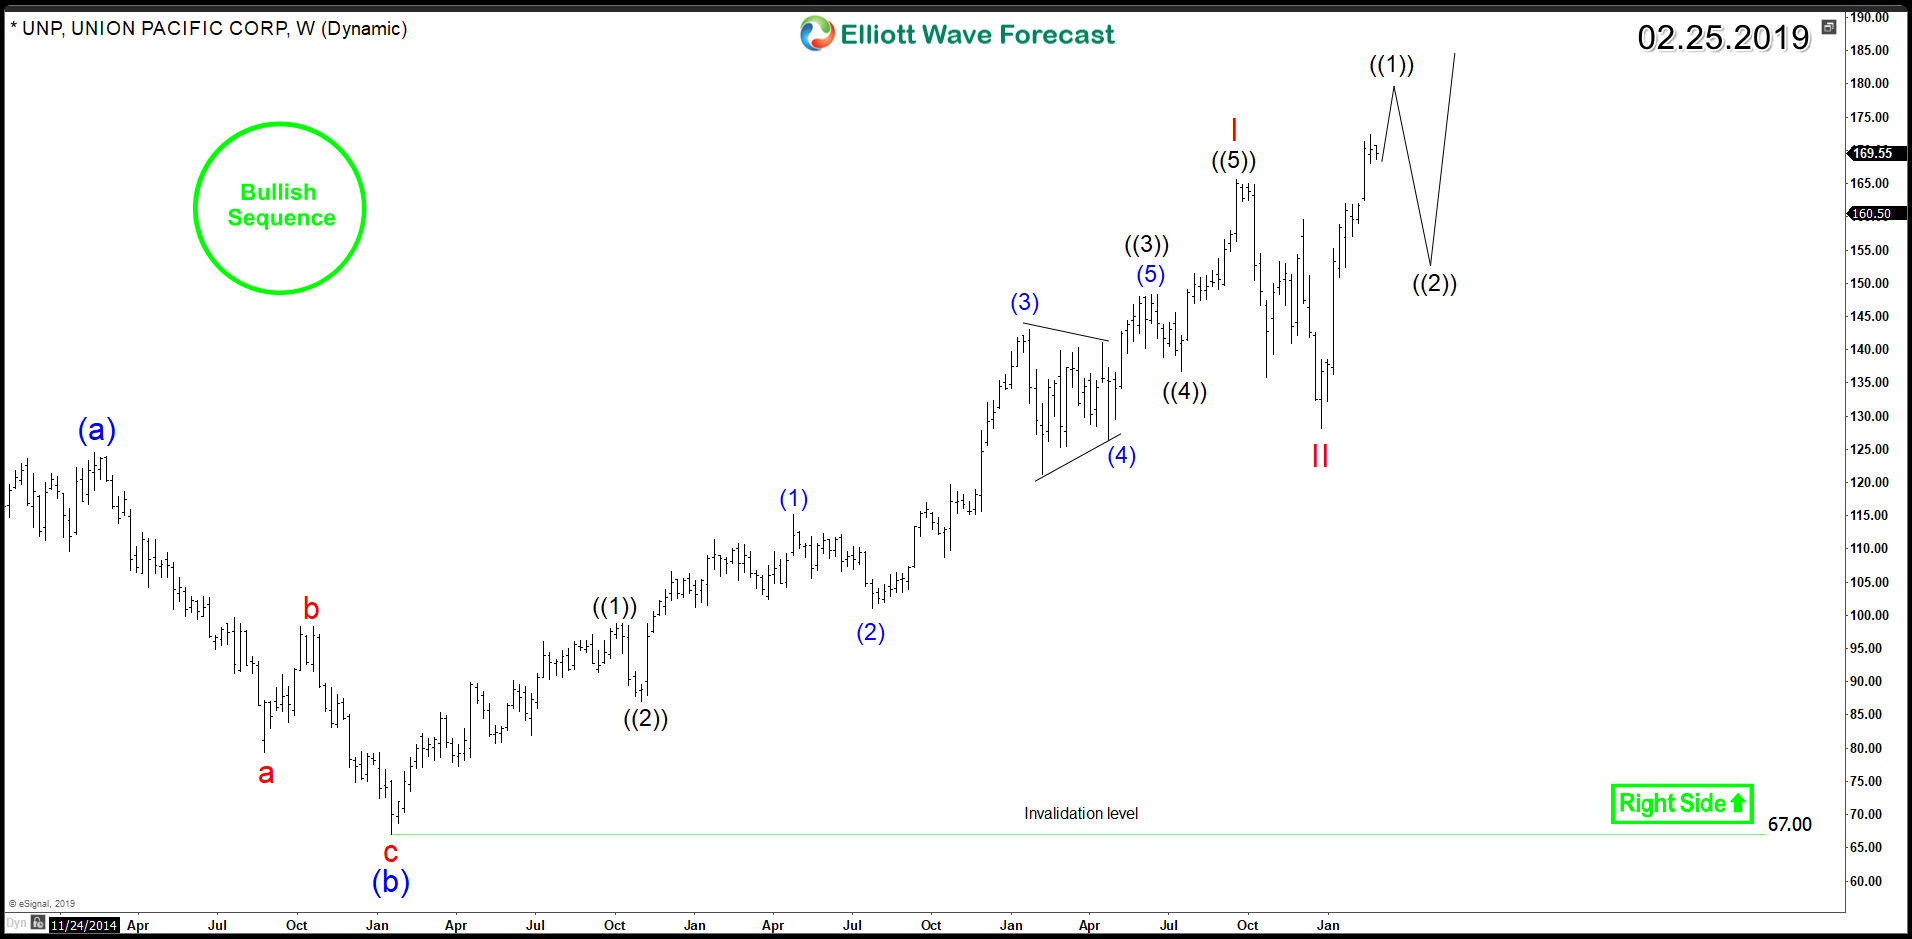
From the January 2016 low, UNP rallied higher in an impulsive 5 waves advance breaking the 2015 peak which opened a new bigger cycle to the upside. The 5 waves rally ended as a wave I in September 2018, then did a 3 waves pullback Zigzag Structure in wave II which reacted higher from the blue box area, $122 – $129.

Up from there, the stock resumed the rally breaking to new all time highs and opening a new bullish sequence to the upside calling for a move toward target area $226 – $287. Therefore, UNP pullbacks are expected to remain supported above the December 2018 low of $127 and find buyers in 3 , 7 or 11 swings.
UNP Elliott Wave Daily Chart
UNP Elliott Wave Weekly Chart
Conclusion
UNP bulls are looking to stay in charge as the stock has a bullish sequence from 2016 and 2018 lows so Investors may be looking ahead to the next couple of weeks for buying opportunities during the coming pullbacks.


